Platform
PLATFORM OVERVIEW
Your Money Line is an all-in-one financial wellness program that makes it easy for employers to offer personalized financial guidance to employees at every stage of life.
PLATFORM OVERVIEW
Your Money Line is an all-in-one financial wellness program that makes it easy for employers to offer personalized financial guidance to employees at every stage of life.
FEATURES
1:1 financial coaching
Smart budgeting & insights
Personalized money podcast
Credit monitoring
ID protection
Goals & assessments
Financial literacy education
Tax filing
Who We Help
SOLUTIONS
Employers
We work with HR teams to round out your benefits
For Healthcare
We aid healthcare staff with financial planning & more
LEARN MORE
Success Stories
See how we're helping teams improve employee wellness
Wall of Love
Read real feedback from some of our clients and users.
Partners
Partner with us
Retirement Advisors
Differentiate your business with a leading financial coaching app
Benefits Brokers
Offer participants holistic wellness with a modern financial benefit
Pricing
Company
LEARN ABOUT YML
About
Learn about our mission, values, & the people who make it happen
Careers
We're hiring!
We’re always looking for stellar folks to join our team
News
Catch the latest YML news
Resources
2026 ANNUAL EMPLOYEE FINANCIAL BEHAVIOR REPORT
See what the latest data reveals about today’s workplace.
Download now
2026 ANNUAL EMPLOYEE FINANCIAL BEHAVIOR REPORT
Financial stress continues to weigh on employees’ focus, well-being, and performance. See what the latest data reveals about today’s workplace.
Download now
GROW WITH YML
Cha-Ching! Total Rewards Community
ROI Calculator
Money Vibe Quiz
learn
Blog
Resources
Newsletter
Watch a demo
Login
Blog Post
5 Alternatives to Smart Dollar: A 2026 Comparison of Financial Wellness Platforms
Kate Swack
January 26, 2026
This is some text inside of a div block.
This is some text inside of a div block.
Blog Post
Why Identity Theft Protection is an Important Employee Benefit
February 7, 2025
This is some text inside of a div block.
This is some text inside of a div block.
Blog Post
Why Baby Boomers Are Delaying Retirement—and What It Means for Employers
February 6, 2025
This is some text inside of a div block.
This is some text inside of a div block.
Blog Post
Financial Stress at Work: The Emotional Weight HR Can’t Afford to Ignore
January 24, 2025
This is some text inside of a div block.
This is some text inside of a div block.
Blog Post
Press Release
Download
Success Story
Webinar
Quiz
Thank you! Your submission has been received!
Oops! Something went wrong while submitting the form.
Blog Post
The Best FinFit Alternatives of 2026: 5 Financial Wellness Platforms Compared
Kate Swack
March 20, 2026
This is some text inside of a div block.
This is some text inside of a div block.
Blog Post
When Employees Borrow From Tomorrow: What 401(k) and 403(b) Loans Are Really Telling You About Your Workforce
Kate Swack
March 19, 2026
This is some text inside of a div block.
This is some text inside of a div block.
Blog Post
March Financial Wellness Toolkit for the Workplace
Kate Swack
March 18, 2026
This is some text inside of a div block.
This is some text inside of a div block.
Blog Post
Your Ultimate Guide to the 2026 SHRM Annual Conference
Kate Swack
March 12, 2026
This is some text inside of a div block.
This is some text inside of a div block.
Press Release
New Your Money Line Survey Finds Nearly Half of Employees Have Changed Jobs Due to Financial Stress
Kate Swack
March 10, 2026
This is some text inside of a div block.
This is some text inside of a div block.
Blog Post
February Financial Wellness Toolkit for the Workplace
Kate Swack
February 12, 2026
This is some text inside of a div block.
This is some text inside of a div block.
Blog Post
5 Alternatives to Smart Dollar: A 2026 Comparison of Financial Wellness Platforms
Kate Swack
January 26, 2026
This is some text inside of a div block.
This is some text inside of a div block.
Blog Post
January Financial Wellness Toolkit for the Workplace
Kate Swack
January 8, 2026
This is some text inside of a div block.
This is some text inside of a div block.
Download
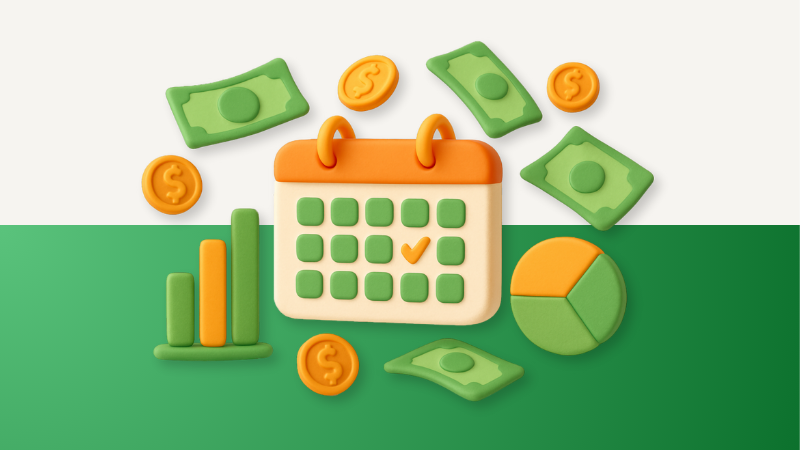
2026 Financial Wellness Calendar for Employees
Kate Swack
December 22, 2025
This is some text inside of a div block.
This is some text inside of a div block.
Blog Post
Gen Z Financial Stress at Work: Causes and Solutions
Kate Swack
December 9, 2025
This is some text inside of a div block.
This is some text inside of a div block.
Blog Post
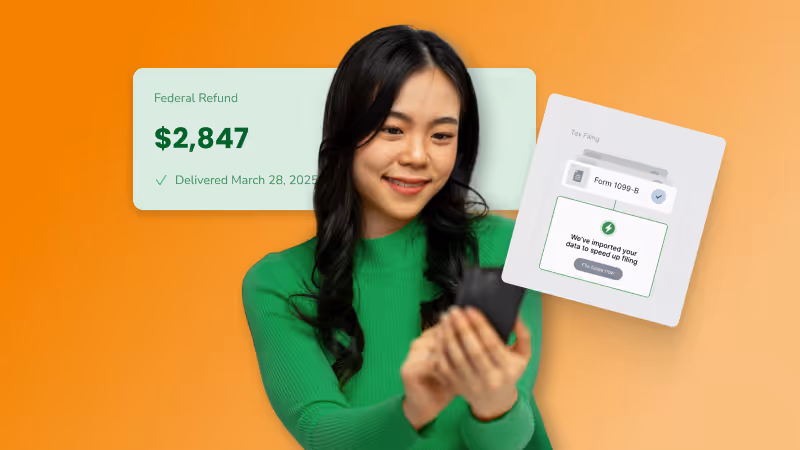
Why We’re Bringing Tax Filing to YML (and Why Your Employees Will Thank You)
Peter Dunn
December 8, 2025
This is some text inside of a div block.
This is some text inside of a div block.
Blog Post
Unlocking Financial Wellness ROI for Thriving Workplaces
Kate Swack
December 5, 2025
This is some text inside of a div block.
This is some text inside of a div block.
Load More
Huh, it doesn't look like we can find that for you. That's weird ಠ_ಠ
.jpg)
.jpg)
.jpg)
.png)
.jpg)
.png)
.png)
.avif)
.avif)